The full ranking
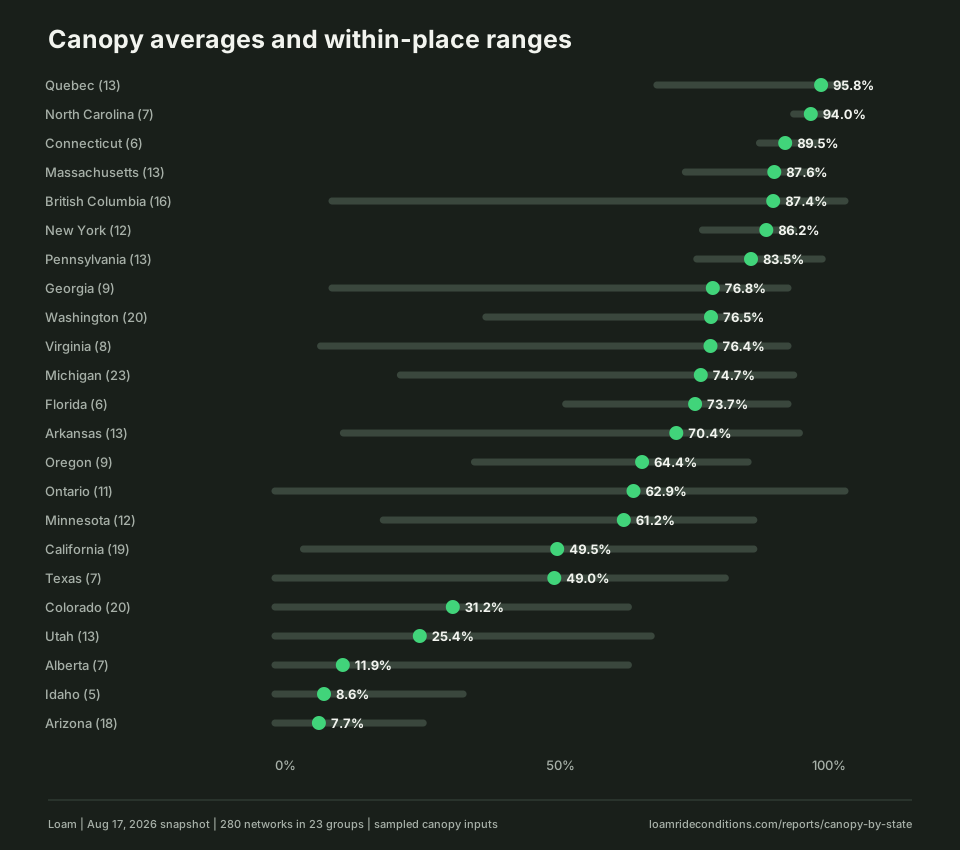
We averaged each network's measured canopy cover by state and province, keeping only places with at least 5 published networks. Fewer than that and one unusually open or unusually shaded trail can swing the average on its own.
| State or province | Networks | Average canopy |
|---|---|---|
| Quebec | 13 | 95.8% |
| North Carolina | 7 | 94.0% |
| Connecticut | 6 | 89.5% |
| Massachusetts | 13 | 87.6% |
| British Columbia | 16 | 87.4% |
| New York | 12 | 86.2% |
| Pennsylvania | 13 | 83.5% |
| Georgia | 9 | 76.8% |
| Washington | 20 | 76.5% |
| Virginia | 8 | 76.4% |
| Michigan | 23 | 74.7% |
| Florida | 6 | 73.7% |
| Arkansas | 13 | 70.4% |
| Oregon | 9 | 64.4% |
| Ontario | 11 | 62.9% |
| Minnesota | 12 | 61.2% |
| California | 19 | 49.5% |
| Texas | 7 | 49.0% |
| Colorado | 20 | 31.2% |
| Utah | 13 | 25.4% |
| Alberta | 7 | 11.9% |
| Idaho | 5 | 8.6% |
| Arizona | 18 | 7.7% |
Climate explains most of it, not all of it
The eastern half of the ranking is thick, humid forest: Quebec, North Carolina, Connecticut, Massachusetts, British Columbia, and New York all average above 85% canopy. The desert Southwest sits at the other end: Arizona at 7.7%, Idaho at 8.6%, Alberta at 11.9%. None of that is surprising on its own.
The exceptions are the more interesting part. Oregon, home to plenty of dense Pacific Northwest forest, averages just 64.4%, well below Washington's 76.5% next door. Texas and California both land in the middle of the pack, near 49%, despite each spanning climates from desert to forest within their own borders. A statewide average flattens that range into one number, which is exactly why Loam scores each network from its own measured canopy instead of a regional estimate.
Reading this table
These are static terrain averages, not conditions. A high-canopy state can still have an open, fast-drying network in it, and a low-canopy state can still have a shaded pocket. Check the individual network, not just the state it's in.
What sits at the extremes
Most shaded
Quebec's 13 published networks average 95.8% canopy, the highest of any state or province in the catalog. North Carolina (94.0%, 7 networks) and Connecticut (89.5%, 6 networks) follow closely.
Most open
Arizona's 18 published networks average 7.7% canopy, the lowest in the catalog. Idaho (8.6%, 5 networks) and Alberta (11.9%, 7 networks) are the only other places under 15%.
The science behind the estimate
Loam starts with a simple physical fact: a trail does not dry just because the rain stops. Water has to enter the ground, move through or across the soil, and leave the trail environment. How quickly that happens depends on the soil, terrain, vegetation, recent weather, and how wet the ground already was.
Soil controls infiltration
Soils do not accept water at the same rate. USDA hydrologic soil groups range from high-infiltration soils such as deep sands and gravels to very slow-infiltration soils associated with clay, high water tables, or restrictive layers. Typical infiltration-rate ranges used in the hydrologic-group framework run from more than 0.30 in/hr for Group A to less than 0.05 in/hr for Group D when thoroughly wet.
Previous rain still matters
A storm does not start with an empty soil profile. USGS notes that soil already saturated from previous rainfall cannot absorb much more, so a larger share of the next storm becomes runoff. Recent weather therefore matters even when the latest storm was not especially large.
Terrain changes the water path
Slope changes how quickly water can move away from a surface. Low spots, drainage features, and trail geometry can change where water collects or leaves the tread. Soil classification and slope are separate pieces of the landscape, which is why both matter to a trail-condition model.
Drying is a water budget
After rainfall, water can remain in the soil, move downward or sideways, run off, or return to the atmosphere through evaporation and plant transpiration. Soil-water-balance models use these processes to estimate changing soil moisture and net infiltration over time.
Why Loam is not a rain timer
There is no useful rule that says every trail becomes rideable after the same number of dry hours. Starting moisture, infiltration behavior, terrain, canopy, and weather after the storm all change the answer.
That is the problem Loam is designed to estimate. The model combines public soil and terrain information with recent weather and network characteristics to estimate how conditions are changing. It is a model of likely trail conditions, not a sensor embedded in the dirt, and it never overrides an official closure.
What the research says
USDA and USGS hydrology work treats infiltration, soil moisture, runoff, canopy, land cover, slope, and evapotranspiration as interacting parts of the water cycle. Recent trail research adds an important piece: rainfall intensity and accumulated rainfall can strongly affect runoff and sediment generation on recreational trails, while wet conditions make trail surfaces more vulnerable to degradation.
USDA NRCS: Hydrologic Soil Groups
Soils are classified by infiltration and runoff behavior when thoroughly wet. The framework distinguishes four main groups and dual drained/undrained classes.
NRCS National Engineering Handbook →USGS: Infiltration and the Water Cycle
Explains how soil characteristics, saturation, land cover, slope, and evapotranspiration affect where precipitation goes.
USGS Water Science School →USGS: Soil-Water-Balance
A published water-budget model that estimates soil moisture, net infiltration, evapotranspiration, and canopy interception from gridded environmental data.
USGS SWB Version 2.0 →NRCS: RUSLE2
A USDA model for estimating soil loss caused by rainfall and associated overland flow, connecting rainfall and runoff to erosion risk.
USDA NRCS RUSLE2 →Fang & Ng, Journal of Environmental Management, 2026
A year-long field study found cumulative rainfall and maximum daily rainfall predicted runoff and sediment yield on recreational trails, with maximum daily rainfall the stronger predictor in that study.
Read the research →These sources describe the physical processes and research Loam draws from. They do not describe Loam's proprietary model or disclose its weights and thresholds.