LoamLoam App StoreGoogle Play

Loam field report

What the average mountain bike network actually looks like

Every network in our published catalog carries a measured elevation, slope, and canopy reading. We lined up all 312 and looked for the shape of the data.

The three numbers behind every verdict

Loam's condition model reads a network's elevation, slope, and canopy at its mapped coordinate, then combines those with current and recent weather. The three terrain readings do not change day to day. They set how a given amount of rain plays out at that specific place.

We pulled the three readings for all 312 networks in the published catalog and looked at what they add up to.

63.7%average canopy cover
3.7°average grade
550maverage elevation
312networks measured

Most networks are more shaded than not

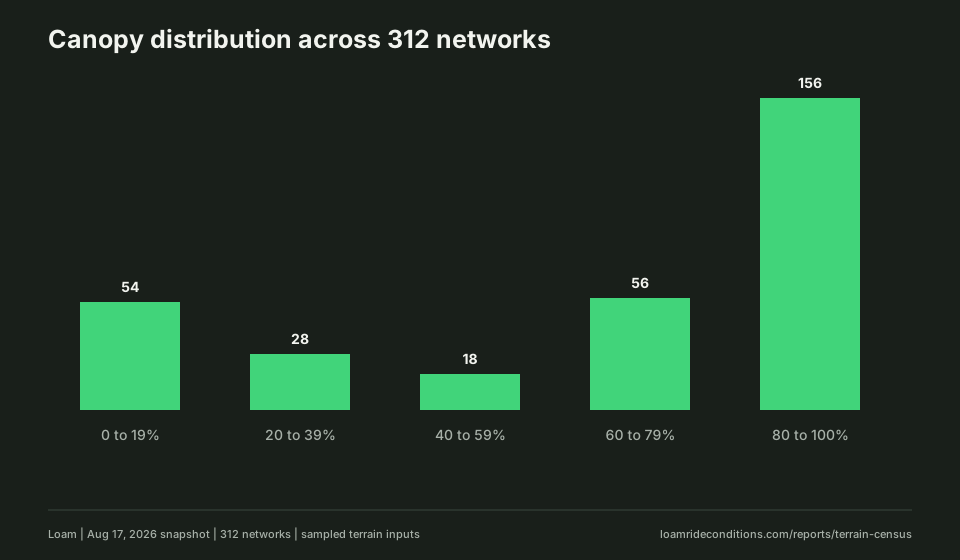
Canopy runs from 0% to 100% across the catalog. Half of all networks sit at 80% cover or higher, which is why the average (63.7%) reads higher than most riders would probably guess. Open, sun-exposed networks exist, but the median network in our catalog rides mostly under trees.

Canopy coverNetworksShare
0 to 19%5417.3%
20 to 39%289.0%
40 to 59%185.8%
60 to 79%5617.9%
80 to 100%15650.0%

Twenty five networks, 8% of the catalog, measure at exactly 0% canopy: fully open ground with no meaningful tree cover. Nineteen measure at 100%: full forest canopy over the entire network. Everything else falls somewhere between.

Least canopy

Avimor (Idaho), Brown's Ranch (Arizona), Canatara Park (Ontario), Captain Ahab/Amasa Back (Utah), and Cave Creek Regional Park (Arizona) all measure 0% canopy.

Most canopy

Parc naturel du Lac-Jerome (Quebec), Partridge Hills (British Columbia), Short Hills Provincial Park (Ontario), The Hydrocut (Ontario), and Top Bridge (British Columbia) all measure 100% canopy.

Grade is concentrated near flat

Loam measures a network's slope as an average grade in degrees, not percent, the same figure shown on every trail page. The median network in the catalog holds a grade of about 2.3°, and the average sits higher, at 3.7°, because a smaller number of steep networks pull it up. Most riding, measured this way, happens on ground gentle enough that grade alone will not clear water off quickly.

Flattest

Anderson Park (Michigan), Kiwanis Recreation Area (Minnesota), and Northwest Community Park (Texas) each measure a 0.1° grade, close to level ground.

Steepest

North Cheyenne Canon Park (Colorado) measures 17.5°, followed by Rattlesnake Mountain Scenic Area (Washington) at 17.1° and Mill Creek Pipeline (Utah) at 16.6°.

Elevation spans sea level to a Colorado ski town

The catalog's elevation range covers nearly the full range North American mountain biking occupies. Marshview Park in Virginia sits 3 meters above sea level. Evolution Bike Park in Colorado sits at 3,024 meters, more than a thousand meters higher than any other network we track.

Lowest

Marshview Park (Virginia) at 3m, Grapefruit Trail (Florida) at 7m, and Pacifica (California) at 7m.

Highest

Evolution Bike Park (Colorado) at 3,024m, Brush Creek (Colorado) at 2,866m, and Golden Gate Canyon State Park (Colorado) at 2,761m. All five of the catalog's highest networks are in Colorado.

What this does and does not show

These are static terrain readings, not conditions. A high, steep, shaded network and a low, flat, open one can both read Prime on a given day. Terrain sets how each network responds to weather. It does not replace checking the weather.

The science behind the estimate

Loam starts with a simple physical fact: a trail does not dry just because the rain stops. Water has to enter the ground, move through or across the soil, and leave the trail environment. How quickly that happens depends on the soil, terrain, vegetation, recent weather, and how wet the ground already was.

Soil controls infiltration

Soils do not accept water at the same rate. USDA hydrologic soil groups range from high-infiltration soils such as deep sands and gravels to very slow-infiltration soils associated with clay, high water tables, or restrictive layers. Typical infiltration-rate ranges used in the hydrologic-group framework run from more than 0.30 in/hr for Group A to less than 0.05 in/hr for Group D when thoroughly wet.

Previous rain still matters

A storm does not start with an empty soil profile. USGS notes that soil already saturated from previous rainfall cannot absorb much more, so a larger share of the next storm becomes runoff. Recent weather therefore matters even when the latest storm was not especially large.

Terrain changes the water path

Slope changes how quickly water can move away from a surface. Low spots, drainage features, and trail geometry can change where water collects or leaves the tread. Soil classification and slope are separate pieces of the landscape, which is why both matter to a trail-condition model.

Drying is a water budget

After rainfall, water can remain in the soil, move downward or sideways, run off, or return to the atmosphere through evaporation and plant transpiration. Soil-water-balance models use these processes to estimate changing soil moisture and net infiltration over time.

Why Loam is not a rain timer

There is no useful rule that says every trail becomes rideable after the same number of dry hours. Starting moisture, infiltration behavior, terrain, canopy, and weather after the storm all change the answer.

That is the problem Loam is designed to estimate. The model combines public soil and terrain information with recent weather and network characteristics to estimate how conditions are changing. It is a model of likely trail conditions, not a sensor embedded in the dirt, and it never overrides an official closure.

What the research says

USDA and USGS hydrology work treats infiltration, soil moisture, runoff, canopy, land cover, slope, and evapotranspiration as interacting parts of the water cycle. Recent trail research adds an important piece: rainfall intensity and accumulated rainfall can strongly affect runoff and sediment generation on recreational trails, while wet conditions make trail surfaces more vulnerable to degradation.

USDA NRCS: Hydrologic Soil Groups

Soils are classified by infiltration and runoff behavior when thoroughly wet. The framework distinguishes four main groups and dual drained/undrained classes.

NRCS National Engineering Handbook →

USGS: Infiltration and the Water Cycle

Explains how soil characteristics, saturation, land cover, slope, and evapotranspiration affect where precipitation goes.

USGS Water Science School →

USGS: Soil-Water-Balance

A published water-budget model that estimates soil moisture, net infiltration, evapotranspiration, and canopy interception from gridded environmental data.

USGS SWB Version 2.0 →

NRCS: RUSLE2

A USDA model for estimating soil loss caused by rainfall and associated overland flow, connecting rainfall and runoff to erosion risk.

USDA NRCS RUSLE2 →

Fang & Ng, Journal of Environmental Management, 2026

A year-long field study found cumulative rainfall and maximum daily rainfall predicted runoff and sediment yield on recreational trails, with maximum daily rainfall the stronger predictor in that study.

Read the research →

These sources describe the physical processes and research Loam draws from. They do not describe Loam's proprietary model or disclose its weights and thresholds.