Loam
Loam
What Loam would have shown
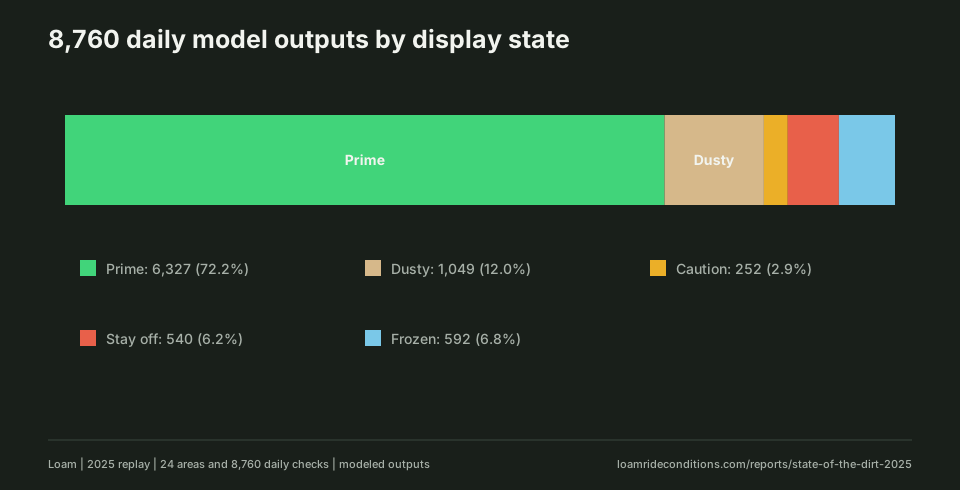
We checked 24 riding areas once a day for all 365 days. That gave us 8,760 checks. Loam would have shown Prime on 6,327 of them and Dusty on 1,049. The rest were Caution, Stay off, or Frozen.
What these numbers are
These are model results from historical weather. They are not observations of trail conditions and do not tell us whether a trail was open.
Most Dusty results came from the Southwest
Loam uses Dusty when the ground has drained but the surface has dried past the Prime range. It is the tan state in the app, labeled Rideable, very dry.
Most of those days came from the Southwest. Phoenix Mountains Preserve in Arizona had 284 Dusty days. Gooseberry Mesa in Utah had 213, and the Montrose/Uncompahgre area in Colorado had 134. Together, those three places made up 60 percent of all Dusty results in the report.
Dusty days were most common in midsummer. We counted 197 in July and 183 in August. A trail could be dry enough to ride without having the moisture that makes dirt feel firm and grippy.
Eastern Canada had the most Frozen results
The strongest winter pattern came from eastern Canada. Mont-Sainte-Anne in Quebec had 110 Frozen days. Bromont, also in Quebec, had 85. Crabbe Mountain in New Brunswick had 82.
January and February accounted for 354 of the year's 592 Frozen results. Loam marks snow-covered ground as Frozen, even when there has not been much rain.
Oregon and Ohio had the most Stay off days
Mt. Hood in Oregon had 77 Stay off days, the most in the report. Caesar Creek in Ohio had 65. Bear Mountain Bike Park in British Columbia had 52, and Hardesty Portal in Oregon had 47.
These were days when the model estimated wet ground with a risk of trail damage.
Montrose/Uncompahgre had 231 Prime days and 134 Dusty days, with no Caution, Stay off, or Frozen results. That consistently dry estimate needs comparison with dated trail reports before drawing conclusions about actual riding conditions.
All 24 riding areas
Each row covers 365 daily estimates at one riding area. The five condition counts add up to 365.
| Riding area | Dusty | Prime | Caution | Stay off | Frozen |
|---|---|---|---|---|---|
| Pacific Coast | |||||
| Bear Mountain Bike Park, British Columbia | 0 | 300 | 13 | 52 | 0 |
| Hardesty Portal, Oregon | 0 | 301 | 13 | 47 | 4 |
| Mount Diablo, California | 88 | 250 | 8 | 19 | 0 |
| Mt. Hood, Oregon | 57 | 186 | 23 | 77 | 22 |
| Southwest and Rockies | |||||
| Gooseberry Mesa, Utah | 213 | 146 | 4 | 2 | 0 |
| Brian Head Resort, Utah | 51 | 277 | 3 | 2 | 32 |
| Phoenix Mountains Preserve, Arizona | 284 | 77 | 2 | 2 | 0 |
| Mill Creek Pipeline, Utah | 85 | 241 | 8 | 10 | 21 |
| Munds Park, Arizona | 73 | 273 | 12 | 5 | 2 |
| Montrose/Uncompahgre, Colorado | 134 | 231 | 0 | 0 | 0 |
| Upper Midwest | |||||
| Bertram Chain of Lakes Regional Park, Minnesota | 32 | 276 | 16 | 12 | 29 |
| Redhead Mountain Bike Park, Minnesota | 0 | 291 | 2 | 8 | 64 |
| Olson Park, Michigan | 0 | 331 | 6 | 18 | 10 |
| Midwest and Southeast | |||||
| Caesar Creek, Ohio | 4 | 274 | 13 | 65 | 9 |
| Athens Academy Trails, Georgia | 0 | 316 | 17 | 32 | 0 |
| Withlacoochee State Forest, Florida | 6 | 338 | 11 | 10 | 0 |
| Tannery Knobs, Tennessee | 0 | 341 | 6 | 17 | 1 |
| Graham Swamp, Florida | 0 | 337 | 11 | 17 | 0 |
| Northeast and eastern Canada | |||||
| Port Jervis Watershed Trails, New York | 0 | 316 | 15 | 26 | 8 |
| Franconia Area Trails, New Hampshire | 18 | 252 | 5 | 20 | 70 |
| Bromont, montagne d'expériences, Quebec | 4 | 242 | 12 | 22 | 85 |
| Mont-Sainte-Anne, Quebec | 0 | 215 | 19 | 21 | 110 |
| Crabbe Mountain, New Brunswick | 0 | 244 | 16 | 23 | 82 |
| Mountain Bike Minto, New Brunswick | 0 | 272 | 17 | 33 | 43 |
Download this study: Network totals CSV | Network totals JSON with method fields
How the replay worked
- We chose 24 riding areas spread across the United States and Canada. Each one had the soil and terrain information Loam needs.
- We requested hours from the Open-Meteo Historical Forecast API for each place, including rain, showers, temperature, wind, relative humidity, two soil-moisture depths, snowfall, snow depth, and surface soil temperature.
- We ran the August 2026 study model once a day at 18:00 UTC from January 1 through December 31, 2025.
- We checked that every hour and every daily result was present before using the numbers.
The archive request covered December 25, 2024 through January 5, 2026. That is 9,048 hours per network, or 217,152 hours across 24 networks. The output window still contains 365 daily checks per network, for 8,760 results.
Each daily evaluation ends at its 18:00 UTC snapshot, so later hours cannot affect that result. The days before January 1 supply prior weather to the model's lookback. The five requested days after December 31 sit outside the output window and cannot enter a 2025 evaluation.
The download preserves the published annual output totals and identifies the study settings and archived script revision. Daily output rows were not preserved with the published study. Reproducing them exactly would also require the original model, catalog, and archived weather response.
What we can learn from this
The replay shows how the model used for this study responded to a year of historical weather, including dry summers in the Southwest and snowy winters in eastern Canada.
We did not have matching daily observations from these trails, and the replay excluded historical park closures. The 24 riding areas are a selected sample, not a survey of all Loam networks.
Dated trail observations would let us check how often these estimates matched the surface riders found.
About Loam estimates
Loam estimates conditions from weather, soil, and terrain. It does not measure the trail surface directly or override an official closure. Read how the estimate works and see the published checks and their limits.